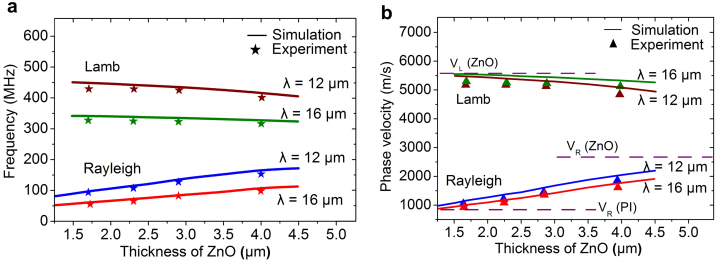
Figure 6. Comparison of experiments and FEA simulation results on the resonant frequency (a) and phase velocity (b) vs. thickness of ZnO film at different wavelengths.
The lines are obtained from simulation, whereas the symbols are the experimental data. The SAW devices have 20 pairs of IDT fingers.

