Figure 5.
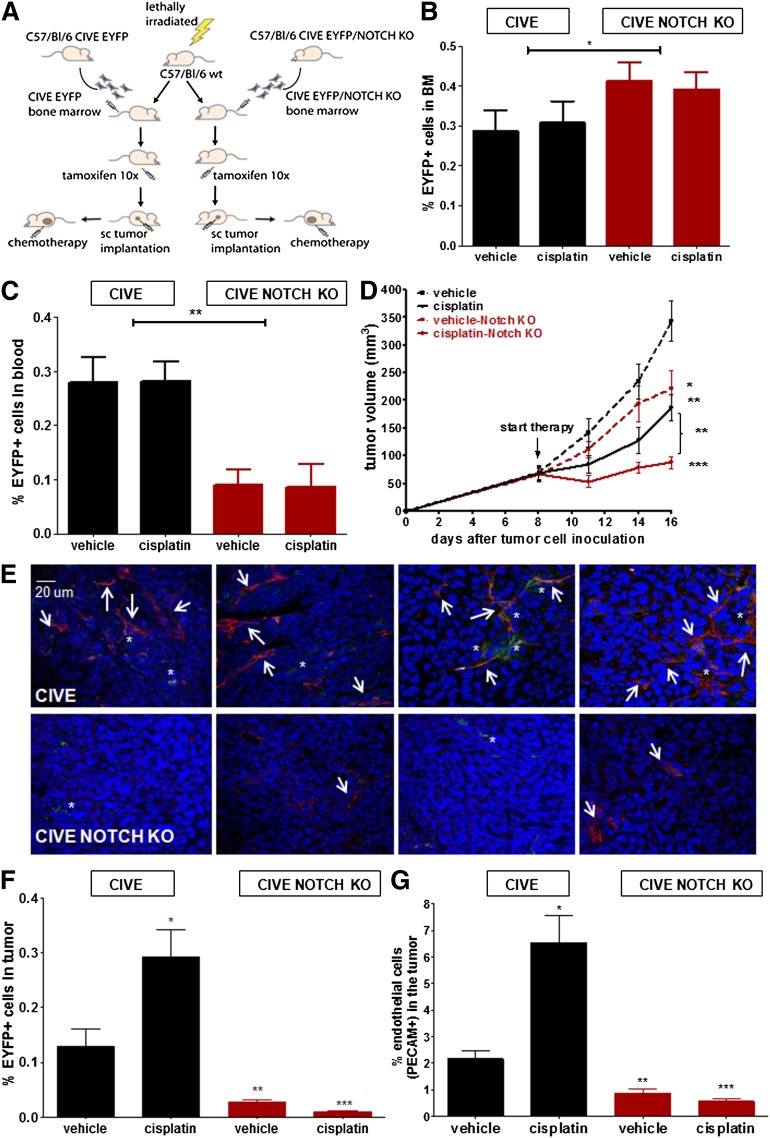
The influx of BMD-VE-cadherin/Notchhigh cells confers chemoresistance and enhanced angiogenesis. (A) Shown is a schematic overview of the transplantation model. Tumor growth occurred in LLC cells in C57BL/6 mice transplanted with either CIVE bone marrow or CIVE–Notch KO bone marrow; mice were either untreated or treated with cisplatin. (B-C) The graphs show a comparison of the EYFP+ cells in (B) the bone marrow (BM) and (C) the blood between the mice transplanted with CIVE or the CIVE–Notch KO bone marrow. (D) The graphs shows a comparison of the tumor growth of LLC cells in C57BL/6 mice transplanted with the CIVE bone marrow vs the CIVE–Notch KO bone marrow, either untreated or treated with cisplatin. (E) Representative confocal pictures show EYFP+ cells in the LLC tumors (blue: DAPI, red: PECAM, green: EYFP) in the mice with the CIVE–Notch KO bone marrow (upper panels) and the mice with the CIVE bone marrow (lower panels). (F) Shown is the contribution of EYFP+ cells to the LLC tumors in BL/6 mice transplanted with CIVE or CIVE–Notch KO bone marrow 8 days after start treatment. (G) The graph shows the percentage of endothelial cells (PECAM+ cells) of the total cells in subcutaneous growing LLC cells in BL/6 mice transplanted with CIVE or CIVE–Notch KO bone marrow 8 days after the start of treatment. *P < .05; **P < .01; ***P < .001 compared with the CIVE vehicle control. The scale bar applies to all images.

