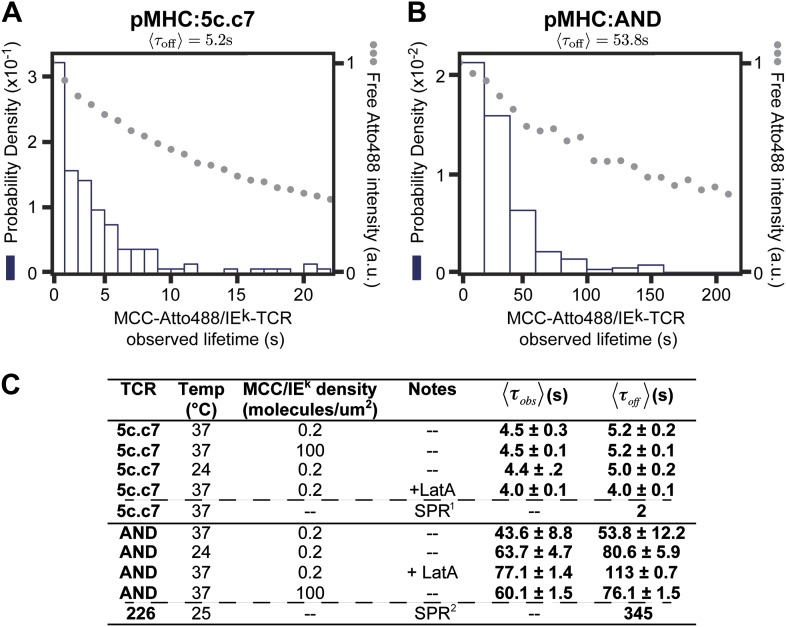
Figure 5. The distribution of live cell single molecule agonist pMHC:TCR molecular binding dwell times is observed directly.
Measured dwell time distributions for both the 5c.c7 (A) and AND (B) TCRs are roughly exponential and match reported solution measurements. Bleaching times, , (grey circles) are measured using agonist pMHC SLB standards without cells and with the same fluorescent label (Atto488) and are significantly longer than observed dwell times, τobs, for both TCRs. (C) Measured values for 5c.c7 and AND CD4+ T cells under varying conditions. Values in columns five and six represent ∼300–600 MCC agonist pMHC molecules per experimental condition from a population of 7–20 cells. Data are representative of at least 5 independent experiments performed on T cell blasts isolated from different mice for both the 5c.c7 and AND TCRs. Uncertainty in the average across different mice, shown in columns five and six, is calculated as the standard error of the mean of the molecular averages from different mice. In some cases (e.g. for cytoskeleton disruption experiments with Latrunculin A) one experiment (representative of 7–10 cells and 100 s of single molecule measurements) may be performed, but these data are always compared to a control sample recorded on the same day with T cell blasts from the same mouse. In these cases uncertainty is reported as the standard error of the mean of the molecular dwell time distribution. SPR measurements for 5c.c7 1(Huppa et al., 2010) and AND-related 226 TCRs 2(Newell et al., 2011), along with single molecule FRET measurements for 5c.c7 1(Huppa et al., 2010), are shown for comparison.

