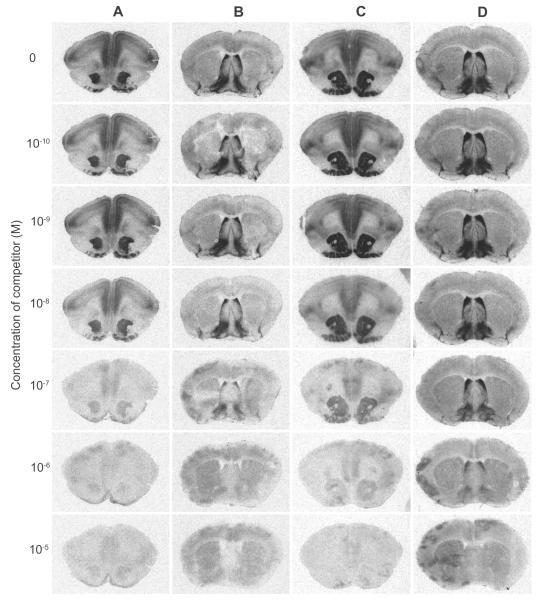
Figure 3.
Representative set of brain images generated from competitive receptor autoradiography. Columns A and B: tissue sections were co-incubated in seven increasing concentrations of 1 in competition for the OTR with 50 pM [125I]-OVTA (A) or in competition for V1aR with 50 pM [125I]-LVA (B). Columns C and D: tissue sections were co-incubated in seven increasing concentrations of 2 in competition for the OTR with 50 pM [125I]-OVTA (C) or in competition for V1aR with 50 pM [125I]-LVA (D).

