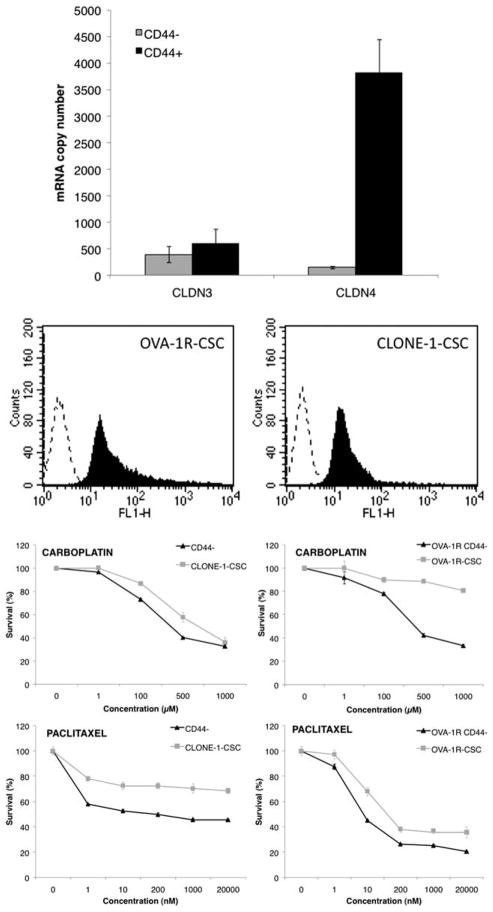
Figure 1.
(Top) Quantitative real-time polymerase chain reaction analysis of claudin-3 and claudin-4 expression is shown. The Y axis represents the fold induction relative to normal ovary expression. The X axis represents CD44+ cancer stem cells and autologous matched CD44− control sample tested for claudin-3 and claudin-4. Claudin-4 expression was significantly higher in CD44+ cancer stem cell lines and cancer stem cell clones when compared with matched autologous CD44− control samples (P < .004). (Middle) Representative flow cytometry histograms are shown of claudin-3 and claudin-4 expression in a representative CD44+ cancer stem cell population (OVA-1R-CSC, left panel) and 1 CD44+ cancer stem cell clone (CLONE-1-CSC, right panel) after labeling with fluorescein isothiocyanate (FITC)-conjugated-C-CPE290-319 peptide. Dashed lines indicate isotype; solid black peaks indicate FITC-conjugated-C-CPE290-319 peptide. (Bottom) Representative dose-response curves after exposure to carboplatin and paclitaxel of OVA-1R-CSC line and matched autologous CD44− control tumor cells (right panel) and of 1 representative cancer stem cell clone (CLONE-1-CSC) versus matched autologous CD44− control tumor cells (left panel) are shown. Survival was assessed by MTS assay as described in the Materials and Methods section. Each point on the cell line graph represents the mean of 3 estimations ± standard error. A significant difference was observed in the IC50 of the CD44+ cancer stem cell populations versus autologous CD44− matched tumor cells when treated with carboplatin or paclitaxel (P < .01).

