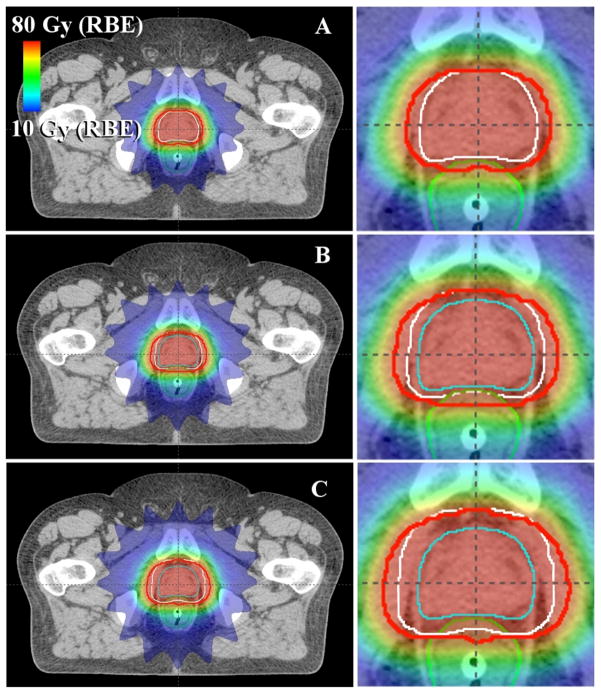
Figure 1.
Axial images showing sample PAT treatment plans with various CTV-to-PTV margins: (A) 0 mm in all directions, (B) 2 mm posteriorly and 4 mm in other directions, and (C) 6 mm posteriorly and 8 mm in other directions. The rectum is shown in green, the CTV in cyan, the PTV in white, and the prescribed isodose line (76 Gy (RBE)) in red.

