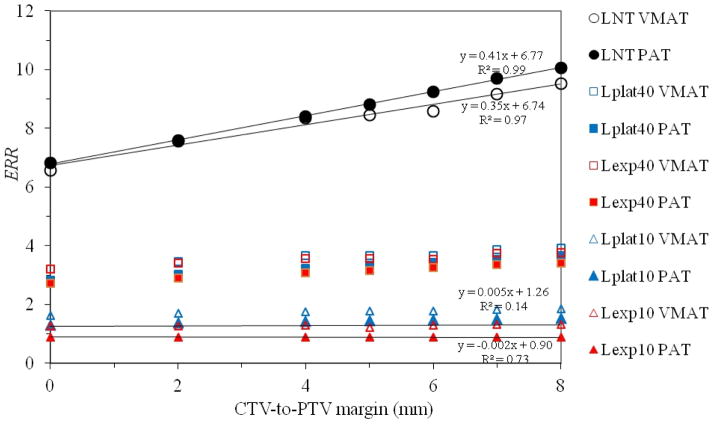
Figure 5.
Plot of ERR versus CTV-to-PTV margin size for VMAT and PAT for all risk models studied. A linear regression is shown for the most extreme cases to illustrate the range of slopes resulting from the various risk models. The positive slope is largest for the linear-non-threshold model, but slope declines to approximately zero for the linear-exponential model with an inflection point of 10 Gy. LNT, Lexp10, Lexp40, Lplat10, and Lplat40 denote the linear-non-threshold, linear-exponential and linear-plateau risk models with inflection points at 10 Sv and 40 Sv, respectively.

