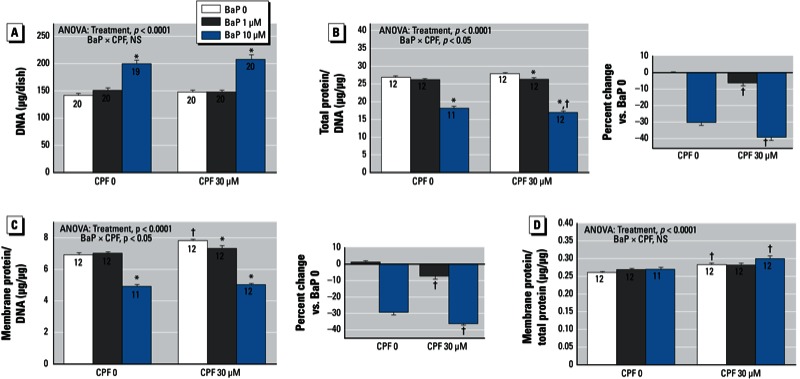
Figure 3.

Effects of BaP in combination with chlorpyrifos (CPF) on indices of cell number and cell growth. (A) DNA. (B) Total protein/DNA ratio. (C) Membrane protein/DNA ratio. (D) Membrane protein/total protein. Where there was a significant interaction, the percent change caused by BaP relative to the corresponding BaP 0 group for each CPF concentration is shown on the right. Data represent means ± SEs of the number of determinations shown within bars. ANOVAs for the main effects of treatment and interactions of BaP with CPF are shown at the top of each panel; NS, not significant. *p < 0.05 compared with the corresponding BaP 0 group. †p < 0.05 compared with the corresponding CPF 0 group.
