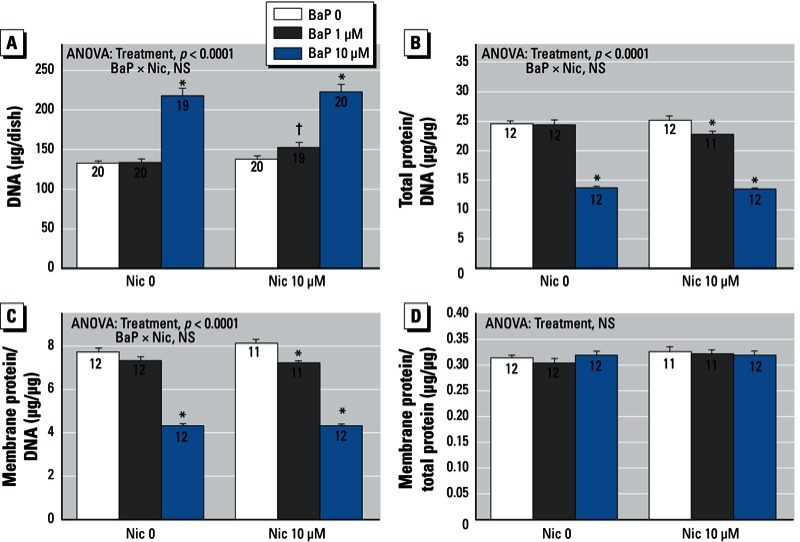
Figure 5.

Effects of BaP in combination with nicotine (Nic) on indices of cell number and cell growth. (A) DNA. (B) Total protein/DNA ratio. (C) Membrane protein/DNA ratio. (D) Membrane protein/total protein. Data represent means ± SEs of the number of determinations shown within bars. ANOVAs for the main effects of treatment and interactions of BaP with nicotine are shown at the top of each panel. NS, not significant. *p < 0.05 compared with the corresponding BaP 0 group. †p < 0.05 compared with the corresponding Nic 0 group.
