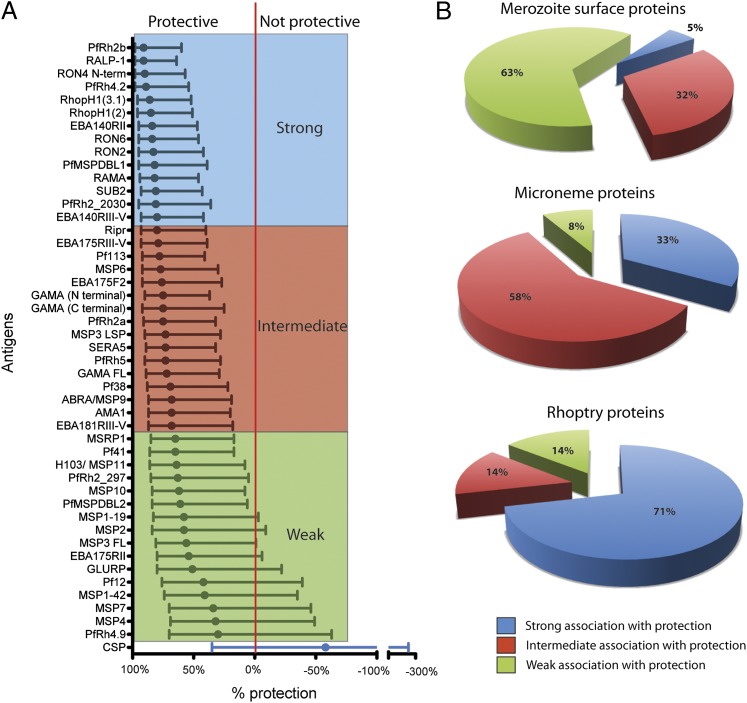
FIGURE 3.
Associations between Abs to merozoite Ags and protection from symptomatic malaria. (A) Association between Abs and protection from symptomatic malaria for each Ag tested in the longitudinal cohort of 206 children. Ags are ranked by the strength of their protective association from most to least protective (top to bottom). The protective association (percentage) for each Ag is derived from the HR calculated by the unadjusted Cox-regression analysis (comparing children with high versus low IgG responses). Circles indicate the percentage protection, and the error bars indicate the 95% confidence interval. The red vertical line indicates percentage protection = 0% (HR = 1). Responses are colored according to the strength of the protective association: strong, intermediate, and weak. These groups were defined as three equal groups, but it should be noted that the intermediate group contains many responses strongly associated with protection. (B) Pie charts showing the number of responses with strong, intermediate, and weak associations with protection according to their location within the merozoite. A higher proportion of microneme and rhoptry proteins had strong-intermediate protective associations for Abs compared with merozoite surface Ags (p < 0.001, χ2 test). The data for HRs (and 95% confidence interval) are provided in Table III.

