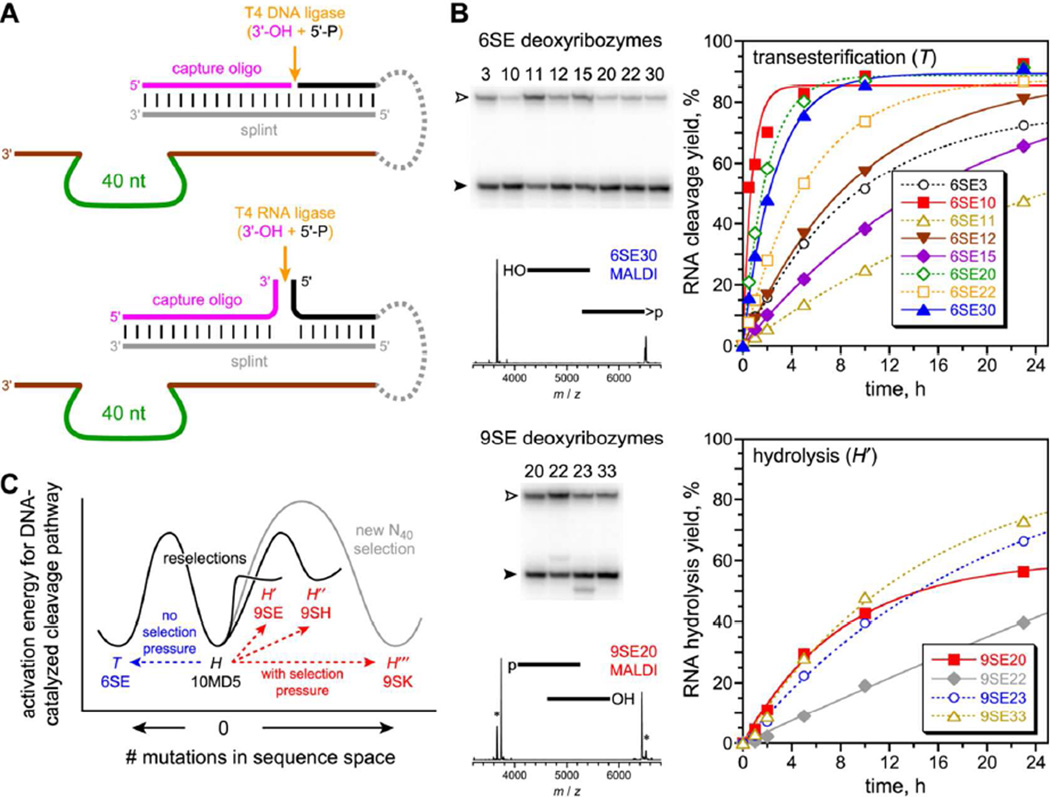
Figure 2.
10MD5 partial randomization and reselection with exclusion or inclusion of hydrolysis selection pressure. (A) Hydrolysis selection pressure by capture of the 5′-phosphate hydrolysis product using a 3′-hydroxyl capture oligonucleotide, a DNA splint, and T4 DNA or RNA ligase. The 5′-hydroxyl formed by transesterification cannot be captured by this reaction. (B) Selection outcomes, revealed by analysis of individual deoxyribozymes from round 6 (no pressure, top) and round 9 (three additional rounds with pressure, bottom). Open arrowhead = substrate; filled arrowhead = product (t = 24 h). Asterisks denote 9SE signals that arise from transesterification rather than hydrolysis, either as background reaction (for PAGE) or during analysis (for MALDI-MS). See Table S1 for MALDI-MS data and cleavage-site assignments for individual deoxyribozymes. See Figure S3 for selection progressions and Figure S4 for individual deoxyribozyme sequences. See Table S2 kobs values. (C) Schematic model for accessing the competing transesterification (T) and hydrolysis (H, H′...) mechanistic pathways in DNA sequence space, starting from the parent 10MD5 sequence and ending with the deoxyribozymes from each of the four cloned selection rounds. This diagram is intended to assist visualization of the relationships among the various selection experiments and plots activation energy (ΔG‡) versus number of mutations, unlike a conventional energy diagram of free energy (G) versus reaction coordinate. See Supporting Information text for a brief explanation of the components of the diagram.

