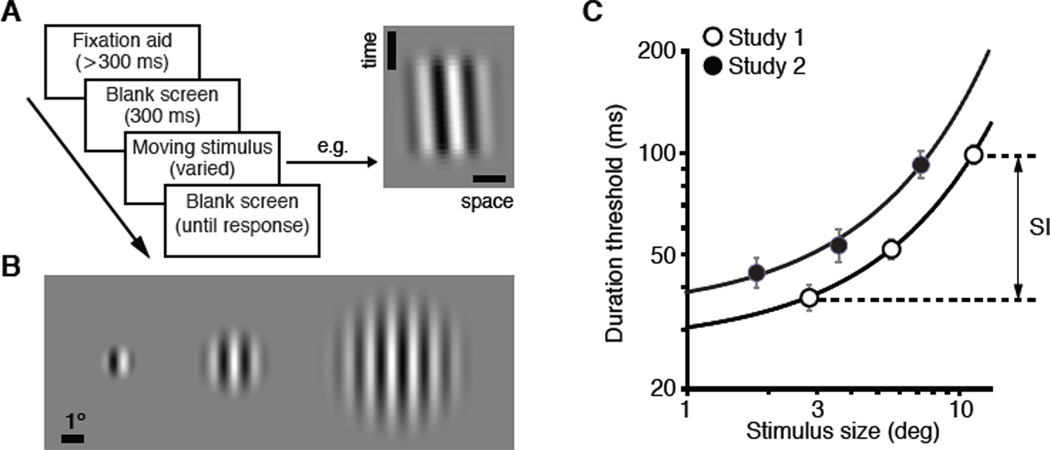
Figure 1. Measurement of spatial suppression: task, stimuli and group level results.
(A) The sequence of events constituting a single trial. Subjects’ task was to simply identify motion direction of a briefly presented moving stimulus. The space-time plot illustrates a rightward moving stimulus. The depicted stimulus duration (53 ms) corresponds to the average threshold for the 3.6° stimulus size (see panel C). Vertical and horizontal scale bars are 10 ms and 1°, respectively.
(B) Three stimulus sizes used in Study 2. Only one stimulus was shown on each trial.
(C) The effect of stimulus size on duration thresholds for discriminating motion direction. Data were fit with an exponential model (a·ebx, R2 > 0.993). Slope, b, is 0.116 and 0.139 for Study 1 and Study 2, respectively. As detailed in Supplemental Experimental Procedures, raw threshold values cannot be compared across studies. Arrows illustrate the computation of SI, defined as the difference of log10 thresholds for large and small stimuli (SI = log10(large stimulus threshold) – log10(small stimulus threshold). Data are represented as mean ±SEM.

