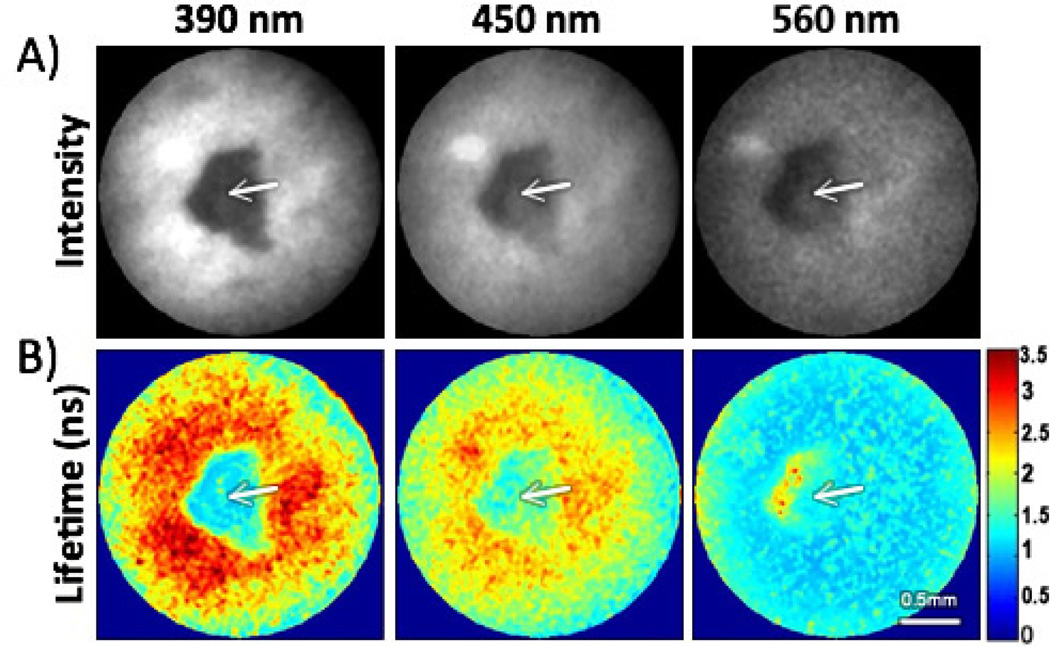
Fig. 3.
In-vivo validation imaging of a hamster cheek pouch: (A) fluorescence intensity maps (B) lifetime maps (colorscale in ns). The arrows indicate a small malignant lesion showing distinct fluorescence intensity and lifetime values than those from the surrounding tissue. Continuous in-vivo imaging of the same lesion was also demonstrated (Media-2).

