Figure 3.

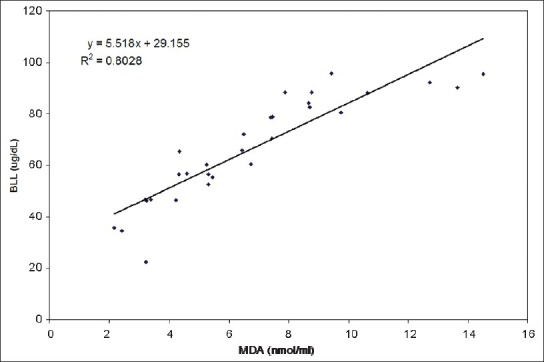
Relationship between blood lead and serum malondialdehyde concentrations among lead exposed workers (Correlation coefficient, r = 0.895; P < 0.001)

Relationship between blood lead and serum malondialdehyde concentrations among lead exposed workers (Correlation coefficient, r = 0.895; P < 0.001)