
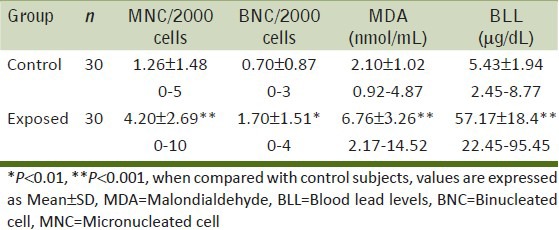
Table 2.
Average number of micronucleated cells, binucleated cells (in 2000 cells per individual), malondialdehyde values and blood lead levels in control and exposed groups
Official websites use .gov
A
.gov website belongs to an official
government organization in the United States.
Secure .gov websites use HTTPS
A lock (
) or https:// means you've safely
connected to the .gov website. Share sensitive
information only on official, secure websites.
Average number of micronucleated cells, binucleated cells (in 2000 cells per individual), malondialdehyde values and blood lead levels in control and exposed groups