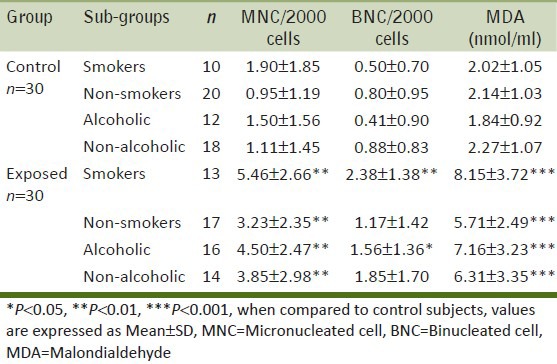
Table 4.
Average number of micronucleated cells, binucleated cells and malondialdehyde values in control and exposed groups with respect to smoking and drinking habits

Average number of micronucleated cells, binucleated cells and malondialdehyde values in control and exposed groups with respect to smoking and drinking habits
