
Fig. 4.
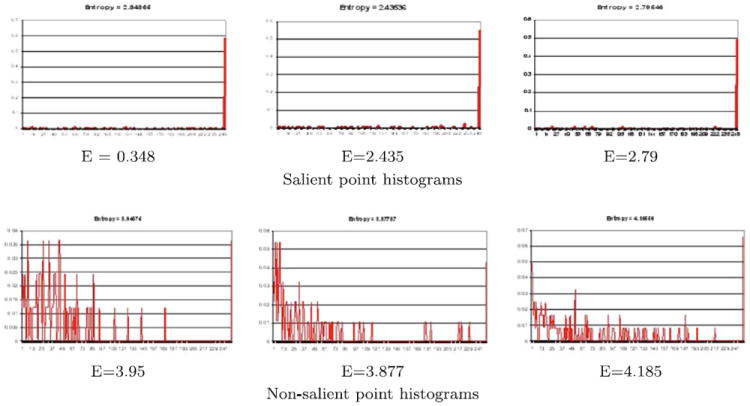
Example histograms of salient and non-salient points. The salient point histograms have a high value in the last bin illustrating a high curvature in the region, while low values in the remaining bins in the histogram. The non-salient point histograms have more varied values in the curvature histogram. In addition, the entropy E of the salient point histogram is lower than the non-salient point histogram (listed under each histogram)