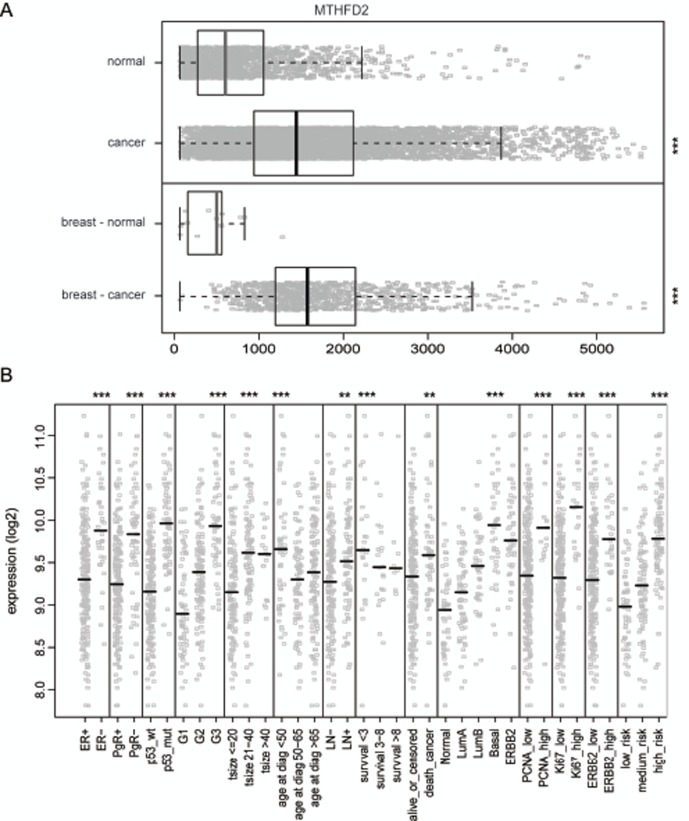
Figure 3. In silico gene-expression analysis of MTHFD2 in clinical breast cancer samples.
A: Box plot analysis of normalized expression values for MTHFD2 mRNA expression in all healthy (n=1659) and malignant tissues (n=5644, ***p < 0.005), as well as in healthy (n=13) and malignant breast tissues (n=957), ***p < 0.005). The box refers to quartile distribution (25-75%) range, with the median shown as a vertical line (grey for normal samples, black for malignant). Data observations which lie more than 1.5*inter-quartile range higher than third quartile, are considered as outliers and are indicated separately. B: Analysis of the association of MTHFD2 mRNA expression with several clinico-phenotypical features in malignant breast tissues. Median value is indicated with a vertical line. The statistically significant p-values are indicated with asterisks (* P<0.05; ** P<0.01; *** P<0.005).

