
Figure 4.
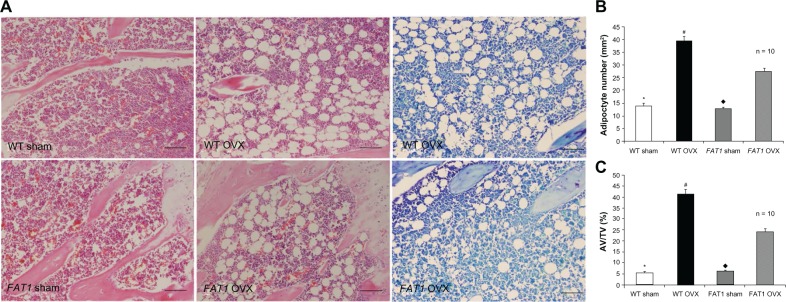
(A–C) Histological analysis of bone marrow adiposity. (A) Hematoxylin and eosin and toluidine blue staining for distal femur bone marrow. Images were taken at 200x magnification. There were fewer adipocytes in the FAT1 OVX group than the wild-type (WT) ovariectomized (OVX) group. (B) #, per mm2) and (C) adipocyte volume/tissue volume (AV/TV) were significantly reduced in the FAT1 OVX group. Three months after ovariectomy, the OVX group showed more bone marrow adiposity than the sham group (P < 0.05).
Notes: #P < 0.05 versus FAT1 OVX; *P < 0.05 versus WT OVX; ♦P < 0.05 versus FAT1 OVX. Scale bars, 100 μm