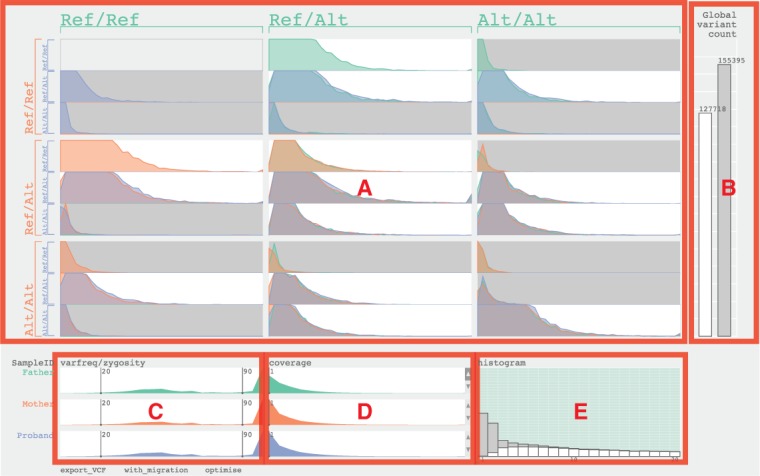
Fig. 1.

The user interface of TrioVis and five sections labelled (A–E) for parent–child trio data from exome sequencing by Illumina HiSEQ 2000 are used. (A) The main table. (B) The global variant count bar graphs. (C) The variant frequency sliders. (D) The coverage sliders. (E) The histogram view showing the father sample
