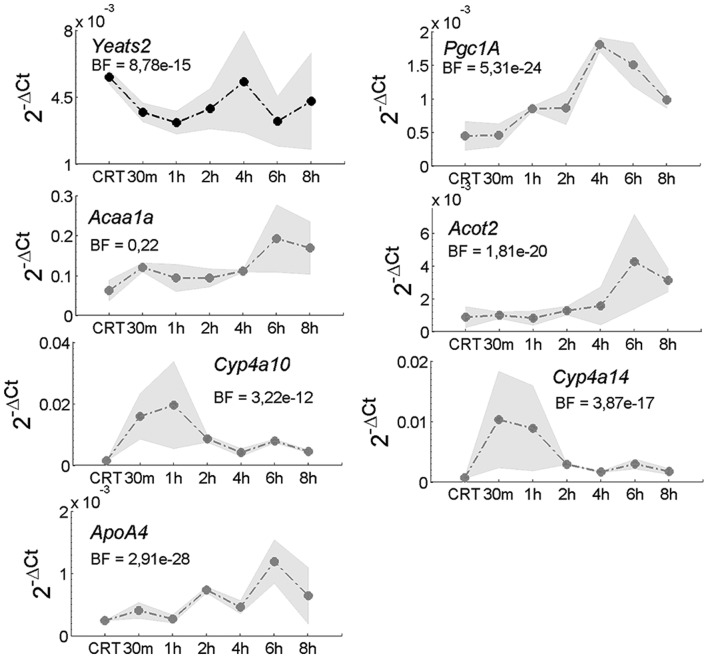
Fig. 3.
Yeats2 expression in hepatocyte cells during starvation. Real-time quantitative PCR measurements of the expression of Yeats2 and a set of marker genes at the indicated time-points following starvation. CRT indicates cell in rich medium. BF indicated the Bayes Factor estimated using Bayesian Analysis of Time Series algorithm. The gray area represents the standard deviation across the two biological replicates. Gene expression was quantified using the ΔCT method with Gapdh used as normalization gene

