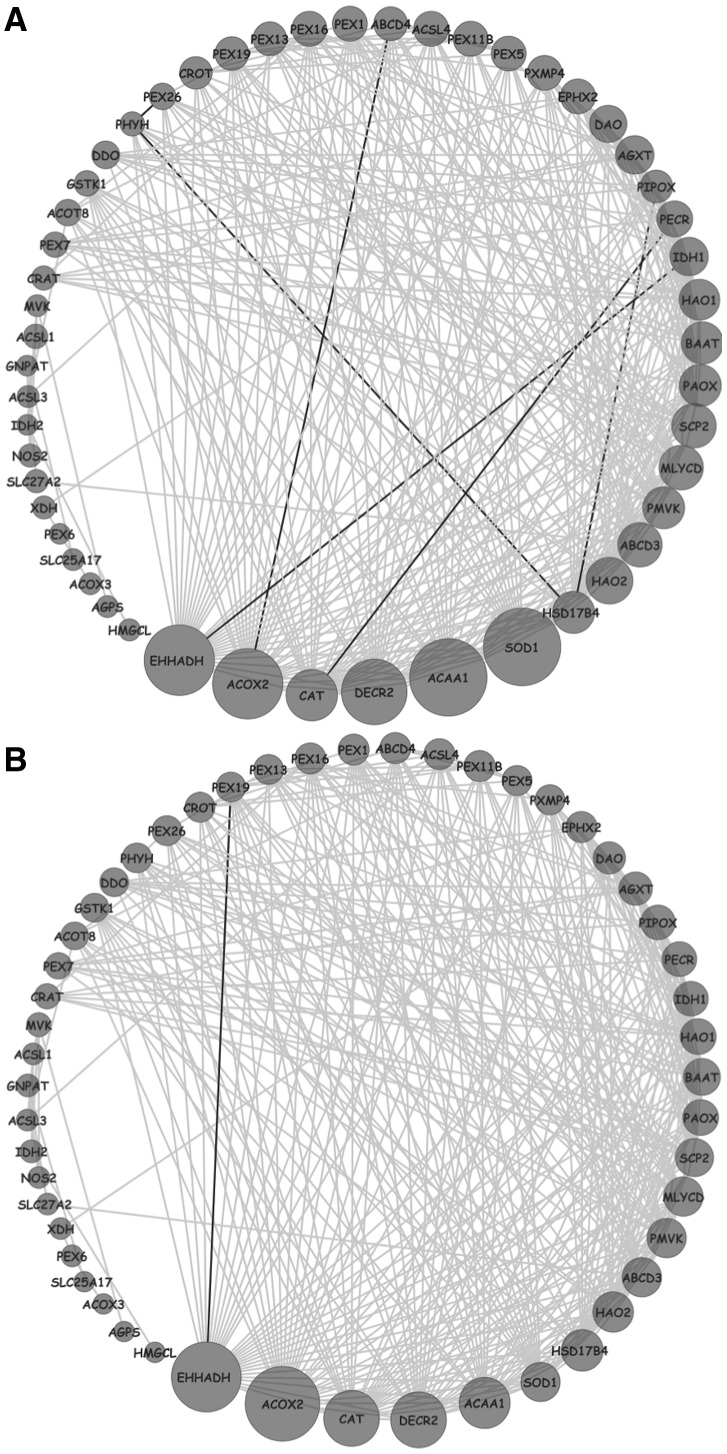
Fig. 5.
Differential Network Analysis of the peroxisome KEGG pathway (M6391) in primary and transformed hepatocytes. Genes in the peroxisome pathway are represented as circles; a significant co-regulation between two genes as a line. The size of the circles is proportional to the difference in the number of edges between the network in transformed hepatocytes versus primary hepatocytes. Gray lines represent edges lost in the network compared with primary cells. (A) HepG2 versus primary hepatocyte; (B) Huh7 versus primary hepatocyte

