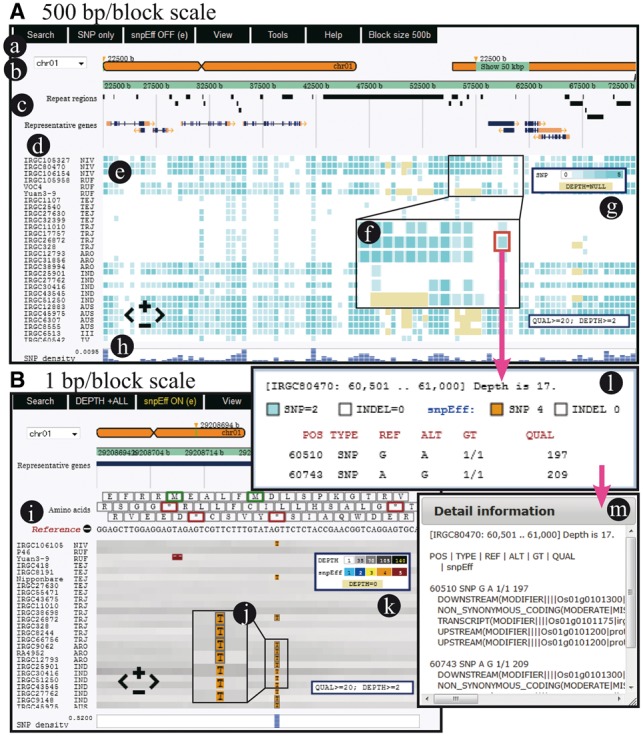
Fig. 1.

Screenshots of tasuke. (A) A view showing variants of 500 bp/block scale. (a) Menu bar for various functions. (b) Chromosomal positions. (c) Annotation tracks. (d) Sample names and related information. (e) Main panel for variant frequencies of block regions. (f) Magnified view of blocks. Blocks without reads are yellow. (g) Indicator for variant frequency and depth. (h) Overall SNP density. (B) A view showing variants and depth of 1 bp/block scale. (i) Amino acids and nucleotides on a reference genome. (j) Variants and their effects. (k) Indicator of levels of variant effects. (l) Variants and average depth information are shown by clicking on a block. (m) Variant effects are shown by clicking on the sub-window of (l)
