Figure 1.
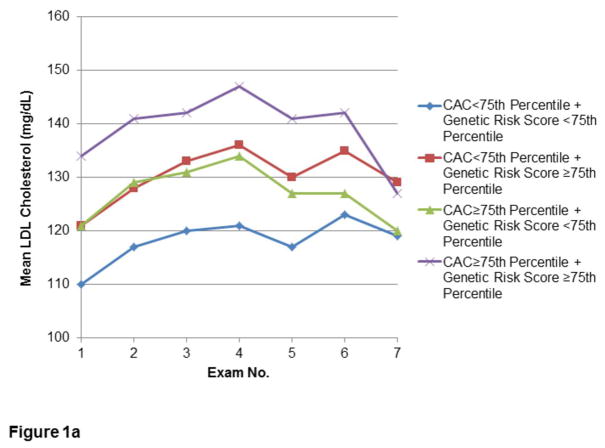
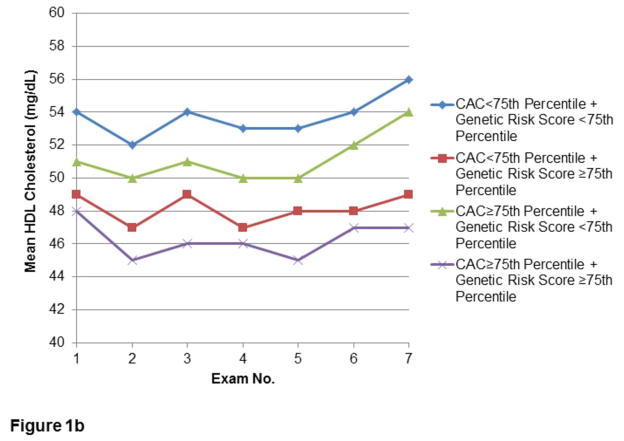
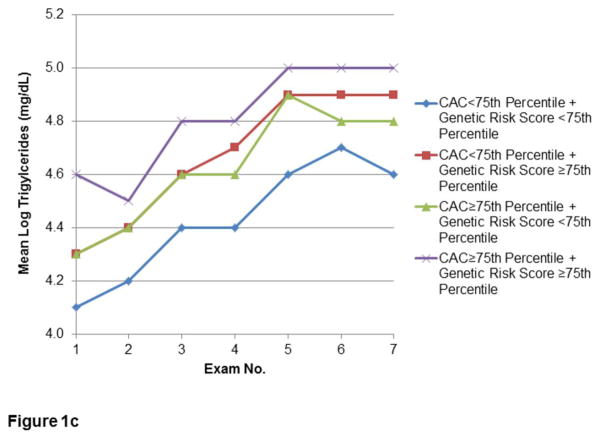
Figures 1a–c. Longitudinal measures of lipid levels.
Measures of LDL-C (1a), HDL-C (1b), and TG (1c) over the first seven Examination cycles in the FHS Offspring Cohort, stratified by extent of CAC and lipid GRS. Included participants attended at least three of the seven Examinations, including both Exams 1 and 7.


