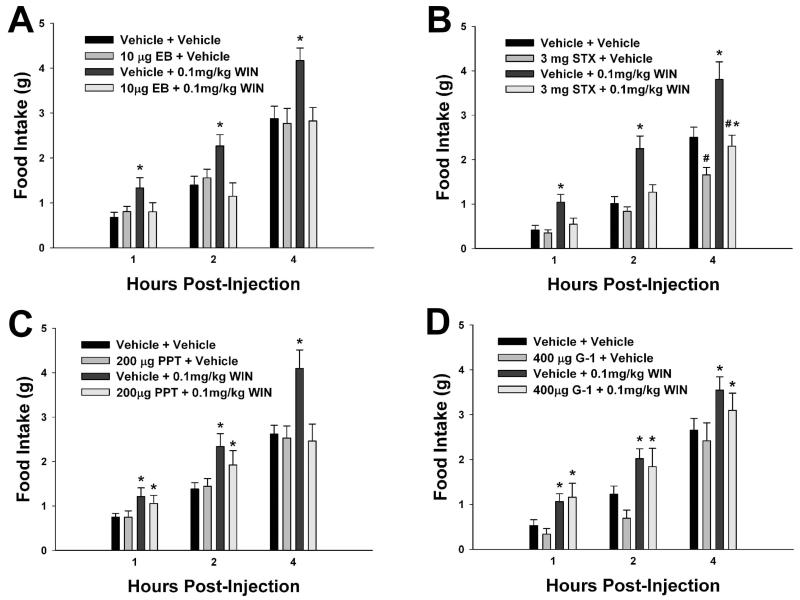
Fig. 4.
EB (A), STX (B) and PPT (C), but not G-1 (D), negatively modulate cannabinoid-induced changes in food intake. Columns represent the mean and vertical lines 1 S.E.M. of the food intake measured at 1, 2 and 4 h for seven days. In B, animals were treated daily (8:00 a.m.) with STX (3 mg; s.c) or its propylene glycol vehicle (0.1 ml; s.c.), and/or with WIN 55,212-2 (0.1 mg/kg; s.c.) or its cremephor/ethanol/saline vehicle. In A, C, and D, animals were subject to the same dosing regimen as described above for WIN 55,212-2 and its vehicle, and treated every other day with EB (10 μg; s.c.), PPT (200 μg; s.c.), G-1 (400 μg; s.c.) or their respective vehicle solutions (0.1 ml; s.c.). *, Values of food intake measured in animals treated with WIN 55,212-2 that are significantly different (multifactorial ANOVA/LSD; P<.05; n=4-7) than those measured in vehicle-treated controls. #, Values from STX-, PPT-, EB- or G-1-treated animals that are significantly different (multi-factorial ANOVA/LSD; P<.05; n=4-7) than those from their vehicle-treated counterparts.

