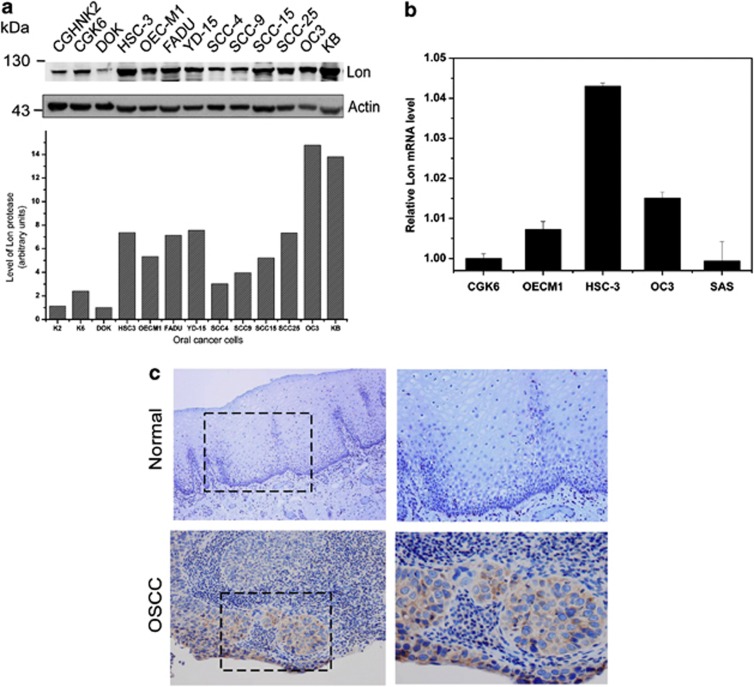
Figure 7.
Lon is upregulated in OSCC. (a) Lon is overexpressed in oral cancer cell lines. The extracts of oral cancer cell lines were immunoblotted with an antibody to Lon and antibody to actin as a loading control. Densiometric analysis of Lon correlated to actin level is shown at the bottom. (b) mRNA expression profile of Lon in oral cancer cell lines. Quantitative real-time Quantitative real-time PCR analysis showed increased Lon expression in samples from three of four oral cancer cell lines. The error bars shown in the graph represent the S.D. from three different experiments. The results were presented as fold increase relative to CGK6 cells (deliberately set to 1). (c) Immunohistochemical analysis of Lon expression in OSCC patients. Representative immunohistochemical analysis of Lon was performed by using paraffin-embedded sections of OSCC and normal epithelium. The representative results shown here are negative staining intensity of normal oral epithelium and moderate staining intensity of oral cancer tissues. Microscopic magnification was × 200 (left) and × 400 (right)

