Figure 3.
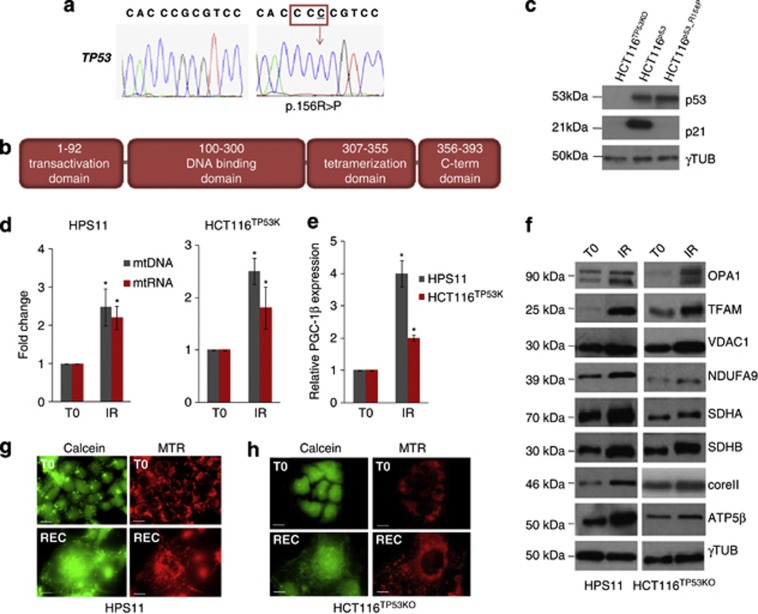
p53 does not directly regulate mitochondrial biogenesis induced by γ-rays. (a) Electropherograms of the HPS11 cells inactivating TP53 mutation (p.156R>P) within the DNA binding domain of the protein. (b) Schematic representation of p53 domains. (c) Western blot analysis of p53 and its target gene p21 in HCT116TP53KO, HCT116TP53KO complemented with wild-type p53 (HCT116p53) and with p.156R>P mutated p53 (HCT116p53_R156P). Gamma tubulin was used as a loading control. One representative experiment of three is shown. (d) Relative mtDNA copy number and mtRNA transcription, in HPS11 and HCT116TP53KO cells upon irradiation (IR). Data are mean±S.D. (n=3, t-test, *P<0.05 versus T0). (e) Relative mRNA quantification of PGC-1β in HPS11 and HCT116TP53KO cells after irradiation. Data are mean±S.D. (n=3, t-test, *P<0.05 versus T0). (f) Western blot analysis of mitochondrial proteins upon IR. (g and h) MitoTracker Red (MTR) and Calcein-AM staining of HPS11 (g) and HCT116TP53KO (h) cells to evaluate mitochondrial mass and network morphology prior (T0) and after irradiation (REC). Magnification × 63/1.4. Length bar corresponds to 25 μm

