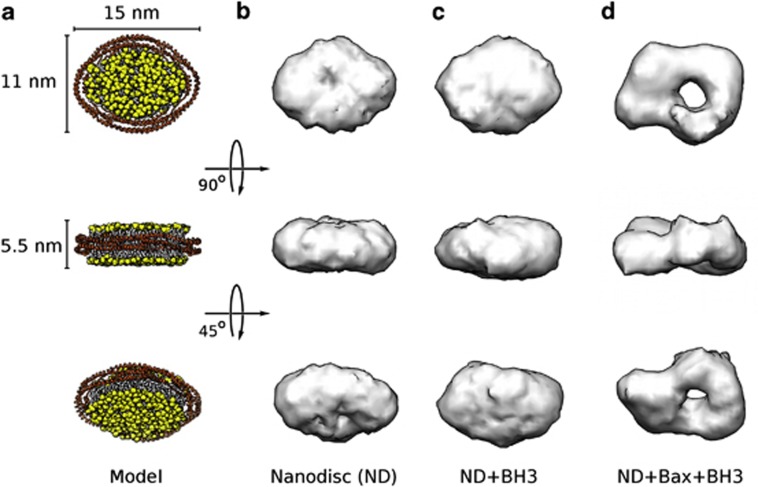
Figure 3.
Three-dimensional reconstructions of nanodisc assemblies. (a) Model of nanodisc derived from the 3D density. The stabilizing protein belt is shown in orange cartoon representation, the lipid bilayer is shown in yellow and white. (b) The 3D reconstruction of nanodisc is shown as a gray surface representation. Contour level chosen to accommodate the length of the protein belt in the circumference of the density. (c) Nanodisc with Bid BH3 peptide. This reconstruction is very similar to that of the nanodisc in (b). Contour level chosen to accommodate the length of the protein belt in the circumference of the density. (d) Nanodisc with Bax and Bid BH3 peptide (predominant sub-population). The contour level was chosen to accommodate the length of the protein belt in the circumference of the density

