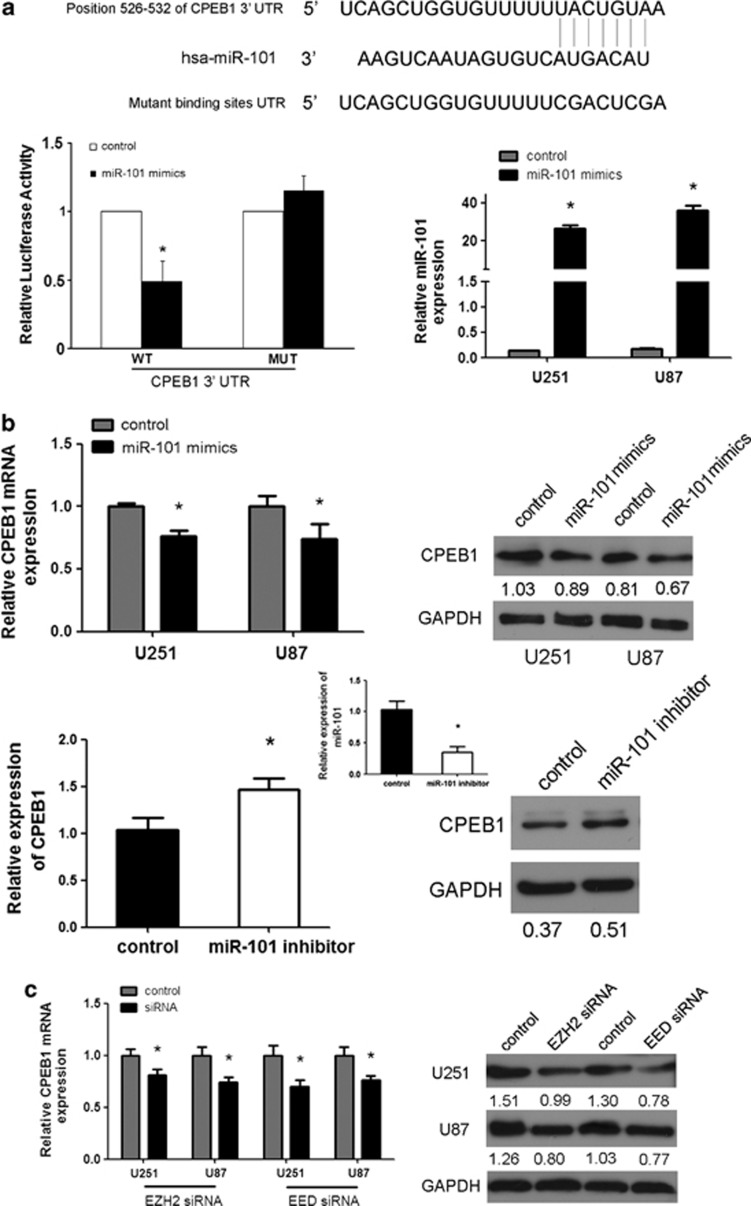
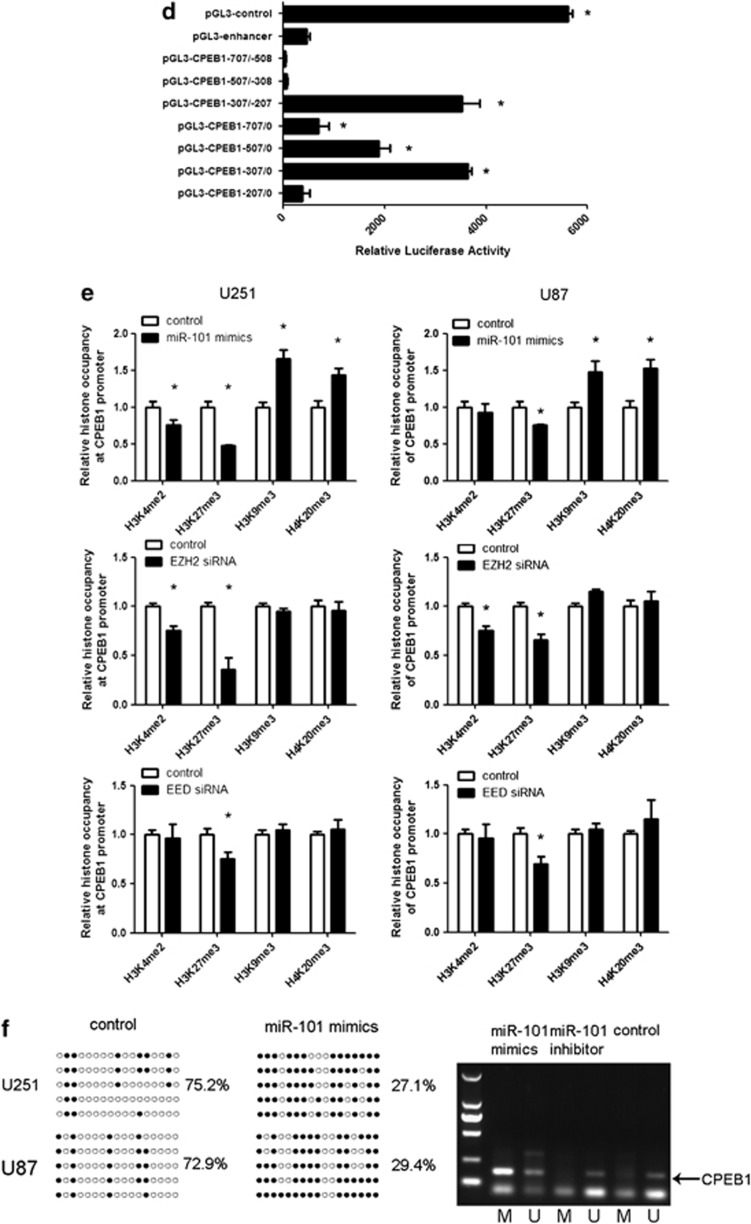
Figure 3.
CPEB1 is a direct and epigenetic target of miR-101. (a) miR-101 binds to the 3′-UTR of CPEB1 as shown by the predicted binding between miR-101 and the 7mer seed matches in the CPEB1 3′-UTR. miR-101 regulates the expression of the CPEB1 3′-UTR reporter constructs. The luciferase reporter assays were performed 48 h after transfection with the indicated pMIR-REPORT plasmids and a renilla transfection control plasmid that were cotransfected with miR-101 or a relevant scrambled control. The data shown are the mean±S.D. of six replicates and are representative of three-independent experiments. *P<0.05. (b) miR-101 regulates CPEB1 expression. A real-time PCR analysis was performed 48 h after transfection with miR-101 mimics, an inhibitor of miR-101 or a scrambled control. A western blot analysis was performed 72 h after transfection with miR-101 mimics, an inhibitor or a scrambled control. The gain of miR-101 function assay was performed in U251 and U87 cells. The loss of miR-101 function assay was performed in U251 cells. *P<0.05. (c) The expression of CPEB1 is regulated by EZH2 siRNA and EED siRNA. A real-time PCR analysis was performed 48 h after transfection with EZH2 siRNA, EED siRNA or a scrambled control. A western blot analysis was performed 72 h after transfection with EZH2 siRNA, EED siRNA or a scrambled control. *P<0.05. (d) A luciferase reporter assay defines the position of the CPEB1 core promoter. 0 is the TSS. The core promoter ranged from −307 to −207. pGL3-control is the positive control, pGL3-enhancer is the negative control. The relative activity as compared with the pRL-TK plasmid is shown. Where the relative luciferase activity is higher than the pGL3-enhancer is considered to embody the core promoter region. *P<0.05. (e) A ChIP assay was performed to detect the H3K4me2, H3K27me3, H3K9me3 and H4K20me3 occupancy of the CPEB1 core promoter. U251 and U87 cells transfected with miR-101 mimics, EZH2 siRNA and EED siRNA were analyzed. *P<0.05. (f) The methylation status of CPEB1 is affected by miR-101. The unmethylated CpG sites are shown as open circles, whereas the methylated CpG sites are indicated by closed circles. For each row of circles, the sequence results for an individual clone of the bisulfite-PCR product are given. The number of methylated CpGs divided by the total number of true CpGs analyzed is given as a percentage on the right of each BSP result. The methylation level of CPEB1 is increased by miR-101 in the U251 and U87 cells as determined with BSP. MiR-101 mimics reverse the methylation status of CPEB1 as determined with MSP in U251 cells


