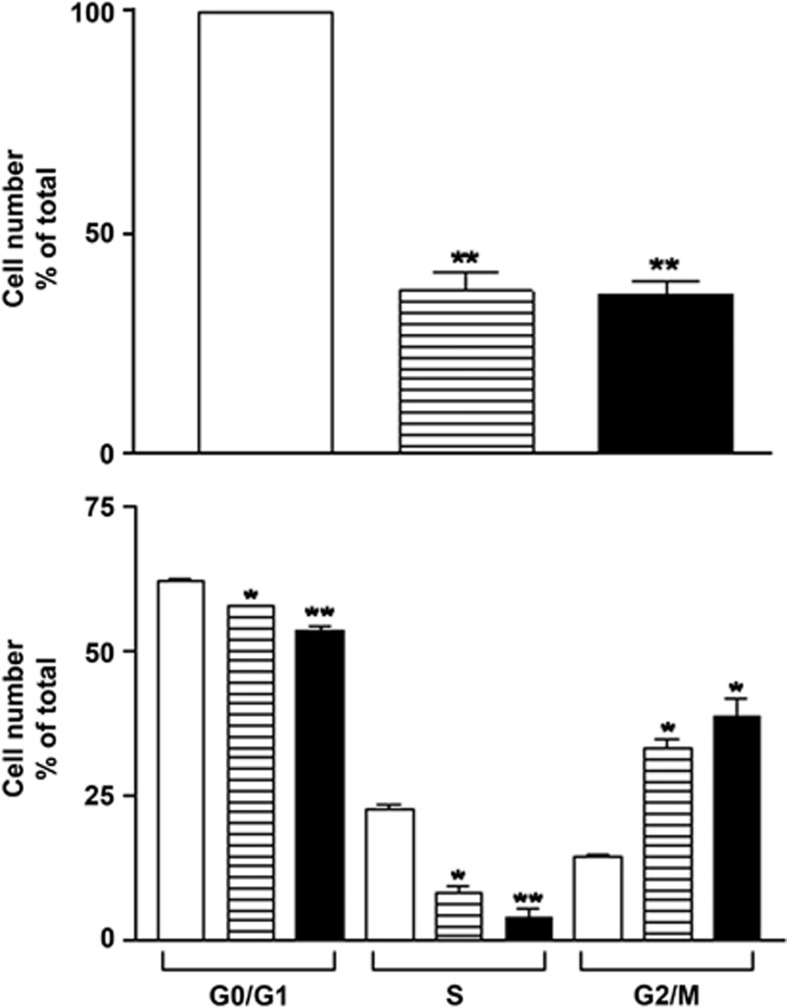
Figure 2.
Effect of hyperosmotic stimulation on ARPE-19 cell number and cell cycle phases. ARPE-19 cells were submitted to 24-h stimulation without (open column) or with 100 mM NaCl (hatched column) or 200 mM sucrose (filled column). (a) Cells were counted in triplicate. (b) Cells were submitted to PI and BrdU staining and analyzed by FACS as described in Materials and Methods. Results are expressed as cell number (in percent of control) and are the mean±S.E.M. (n=3). Data were analyzed using repeated-measures ANOVA and Tukey's multiple comparison tests. *P<0.01; **P<0.001 compared with control

