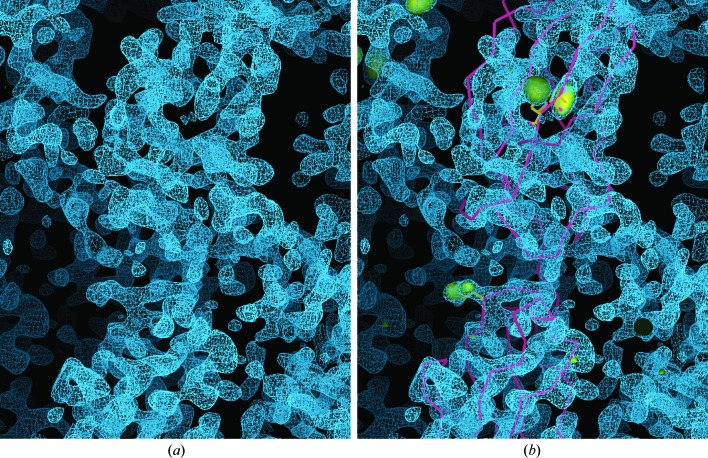
Figure 3.
Preliminary structure of Robo1Fn23. (a) Selenomethionine SAD experimental electron-density map (presented as blue mesh) after solvent-flattening by AutoSol/RESOLVE. Note the clear protein–solvent boundaries and the fragmented electron density. (b) As (a) but with the selenium substructure locations presented as yellow volumes contoured to 4σ (from the AutoSol/Phaser map). Using the three selenomethionine sites as anchors, the Fn2 and Fn3 homology models (shown as a yellow backbone trace) were manually docked into the RESOLVE map.

