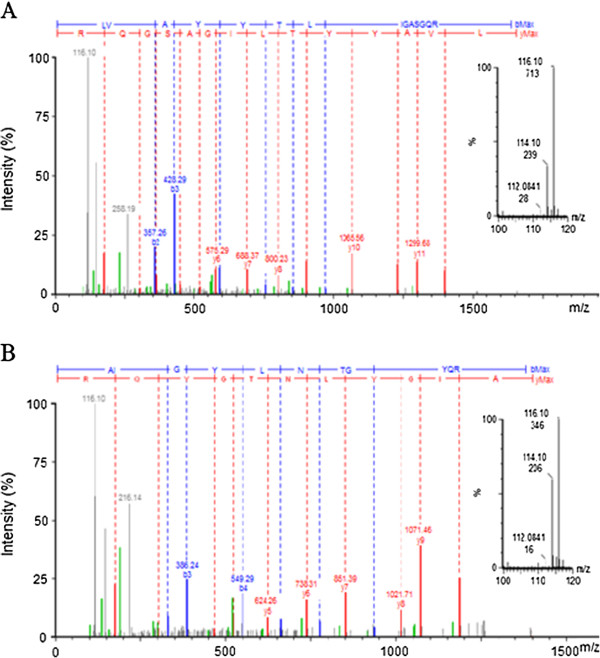
Figure 5.

Representative MS/MS spectra of iTRAQ-labeling peptides derived from C3 and A2M. For each MS/MS spectrum, b- and y-type fragment ions enable peptide identification, whereas the intensity counts of peak areas for each of the iTRAQ signature ions enable quantification of the peptides and proteins. A, MS/MS spectra of the peptide “LVAYYTLIGASGQR” from complement C3β. B, MS/MS spectra of the peptide “AIGYLNTGYQR” from A2M. The pair of reporter ions (m/z116 and m/z114) was highlighted in the enlarged inset map.
