
Figure 6.
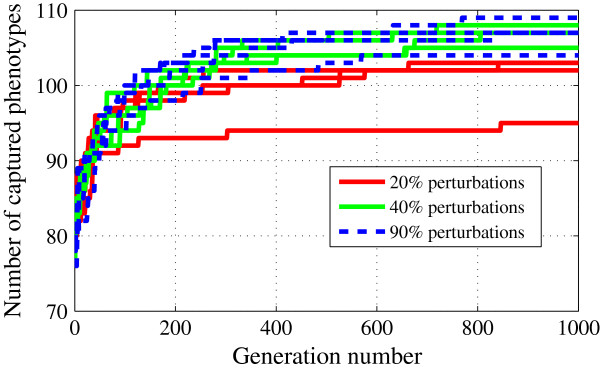
Effects of hypercube size used in LH sampling on the optimization. Increase in the number of mutants captured with initial populations generated by ±20% (red lines), ±40% (green lines) and ±90% (blue lines) perturbations around the starting parameter vector. Once again, the independent runs for each perturbation setting have identical initial populations, but different random number sequences used in the mutation and crossover operations in DE.