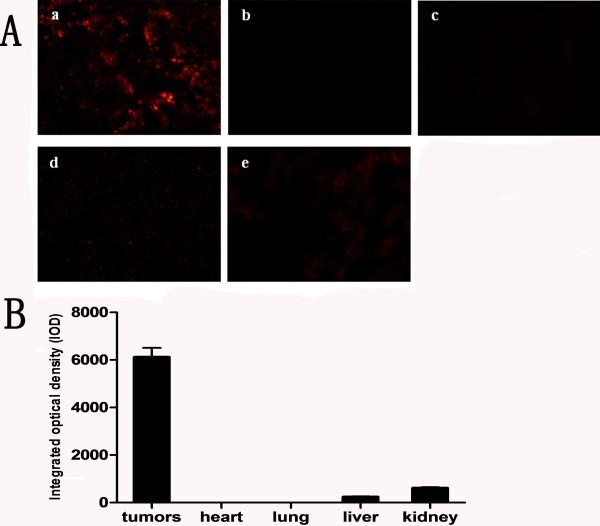
Figure 2.
Distribution of folate-nanoliposome entrapped MYCN siRNA: A, Cy3 fluorescence of different tissues. a, tumors tissue; b, heart; c, lung; d, liver; e, kidney. This graph is one representative result of three views; B, Quantitative analysis of fluorescence intensity of each tissue. Fluorescence intensity was expressed as integrated optical density (IOD). Results are expressed as means ± SE.

