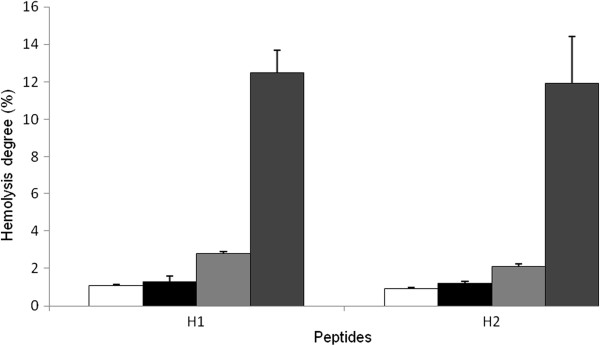
Figure 4.

Hemolytic activity of H1 and H2 peptides from Holothuria tubulosa hemocytes against rabbit blood cells at different concentrations: white square symbol = 1.5 mg/ml; Black square symbol = 3.2; gray square symbol = 6.2; dark gray square symbol = 50 mg/ml. Data are the mean value of three separate experiments and expressed as percentage of hemolysis ± SD.
