
Figure 4.
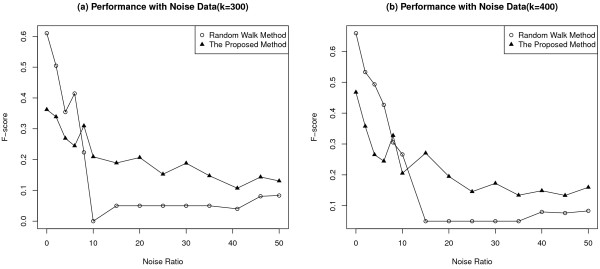
Five-fold cross-validation performance evaluation. In cross validation, different ratios of noise data were added to input data, with the ratio changing from 0 to 50, where 0 meant only known breast cancer genes were used as input data. Performance was evaluated in terms of the F-score. k was a ranking threshold to judge a ranked gene as a true breast cancer gene by the proposed method. (a)k=300; (b)k=400.