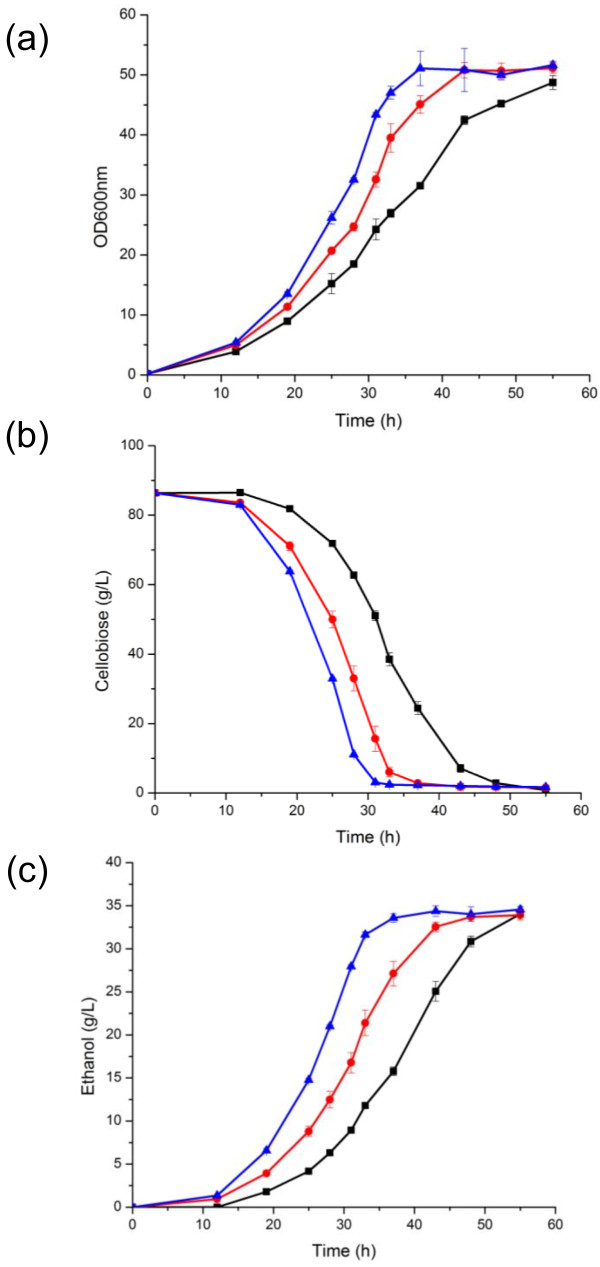
Figure 2.
Fermentation profiles of the cellobiose utilization pathways under oxygen-limited conditions. The black squares represent the strain harboring the wild-type pathway, the red circle is the strain harboring the R1 pathway and the blue triangle is the strain harboring the R2 pathway. (a) Growth curve, (b) Cellobiose utilization, (c) Ethanol production. Error bars are derived from the standard deviation of biological triplicates.

