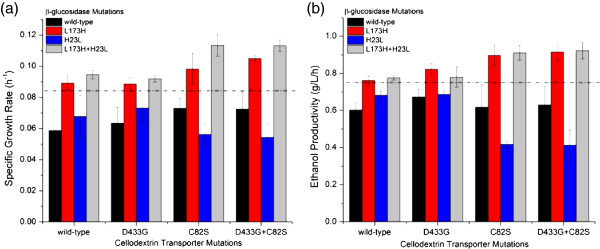
Figure 3.

Pathway analysis to determine how each mutation contributes to the improved phenotype. The graphs depict the (a) growth rate and (b) ethanol productivity of the strains containing the indicated individual and combined mutants of the pathway grown on cellobiose. Each round of directed evolution discovered a mutation in both proteins and these data depict how individual mutations from each round of evolution contributes to the phenotype of the strain harboring the mutant pathway. The x-axis represents the individual and combined mutations of the cellodextrin transporter and each bar depicts the individual and combined mutations of the corresponding β-glucosidase enzyme of the strain. The black bar is wild-type β-glucosidase, the red bar is is L173H mutant, the blue bar represents the H23L mutant, and the grey bar is the double mutant L173H + H23L. The dotted lined denotes values above which are statistically significant over the wild-type (p < 0.05) as determined through a student’s t-test. Error bars represent the standard deviation of biological triplicates.
