
Figure 2.
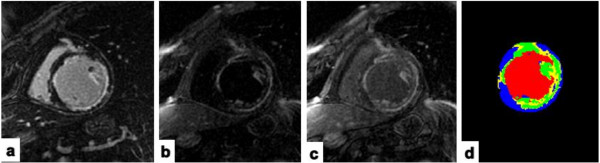
A patient with ischemic heart disease demonstrating both PM involvement and a greater peri-infarct GZ of 18.5% determined by MCLE had ICD shocks for sustained VT at follow-up. a: IR-FGRE image showing one PM involvement; b-c: MCLE images clearly demonstrating both PM involvement; d: Peri-infarct GZ map from MCLE: yellow color indicating peri-infarct GZ, green color indicating core MI, red color indicating blood pool, and blue color indicating healthy myocardium.