
Figure 5. Parkin fragment screen data.
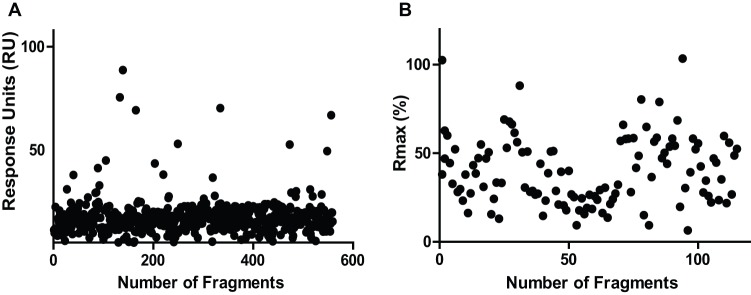
(A) Graphical representation of a typical run of the Parkin fragment screen representing 10% of the total number of fragments screened (560 fragments). The binding level of each fragment of the run is shown in Response Units (RU) on the x-axis and the number of fragments on the y-axis. Experiments were performed on a Biacore 4000 instrument w buffer containing 2% DMSO. FL-FLAG Parkin was captured on a CM5 sensor chip with immobilized anti-FLAG antibody at a stoichiometry of (3∶1) (Parkin:Ab). Fragments were injected at 25 μM in buffer containing 2% DMSO All data were reference subtracted, solvent corrected and adjusted for changes in surface activity during a run.(B) Fragment binding levels as %Rmax of single concentration SPR hits at 25 uM of a screen of 5260 fragments. Only hits with a binding level greater than 3-fold standard deviation (SD) and acceptable sensorgrams are shown.