
Figure 5.
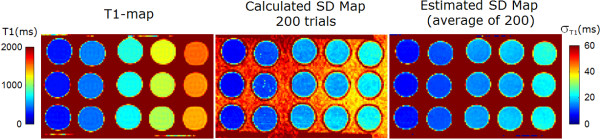
T1-map (LEFT) for CuSO4 doped agar gel phantoms for varying T1 and T2, corresponding SD map calculated from 200 trials (CENTER), and mean of estimated SD maps for 200 trials using proposed method (RIGHT).
Official websites use .gov
A
.gov website belongs to an official
government organization in the United States.
Secure .gov websites use HTTPS
A lock (
) or https:// means you've safely
connected to the .gov website. Share sensitive
information only on official, secure websites.
T1-map (LEFT) for CuSO4 doped agar gel phantoms for varying T1 and T2, corresponding SD map calculated from 200 trials (CENTER), and mean of estimated SD maps for 200 trials using proposed method (RIGHT).