
Figure 7.
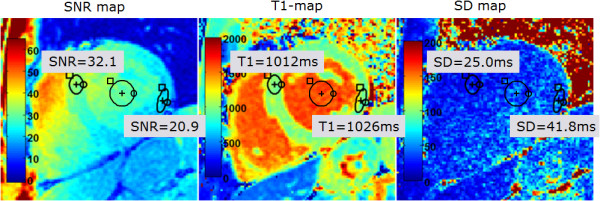
SNR map (left), T1-map (center), and SD map (right). Note the increased T1 standard deviation of T1 at the lateral wall corresponds to decreased SNR resulting from drop off of surface coil sensitivity.
Official websites use .gov
A
.gov website belongs to an official
government organization in the United States.
Secure .gov websites use HTTPS
A lock (
) or https:// means you've safely
connected to the .gov website. Share sensitive
information only on official, secure websites.
SNR map (left), T1-map (center), and SD map (right). Note the increased T1 standard deviation of T1 at the lateral wall corresponds to decreased SNR resulting from drop off of surface coil sensitivity.