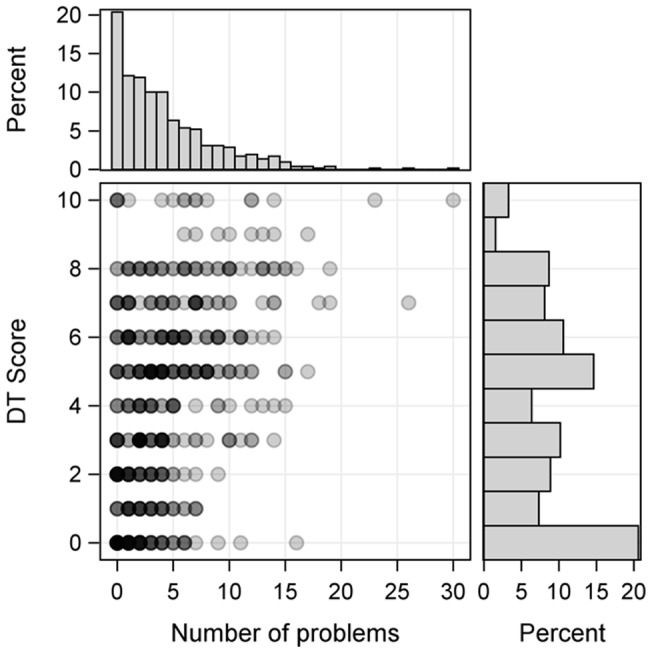
Figure 3. Joint distribution of DT scores and number of problems.

The scatter plot (bottom left) depicts the association of the DT score and number of problems. The darkness of the dots indicates the number of patients having a particular combination of number of problems and the DT score. Dark shades correspond to many patients, light shades correspond to few patients. The histograms for the number of problems (top left) and for the DT score (bottom right) show the marginal distributions of these two traits.
