Figure 4. Inter-rater reliability matrix for mRS from Wilson et al [26] used as confusion matrix.
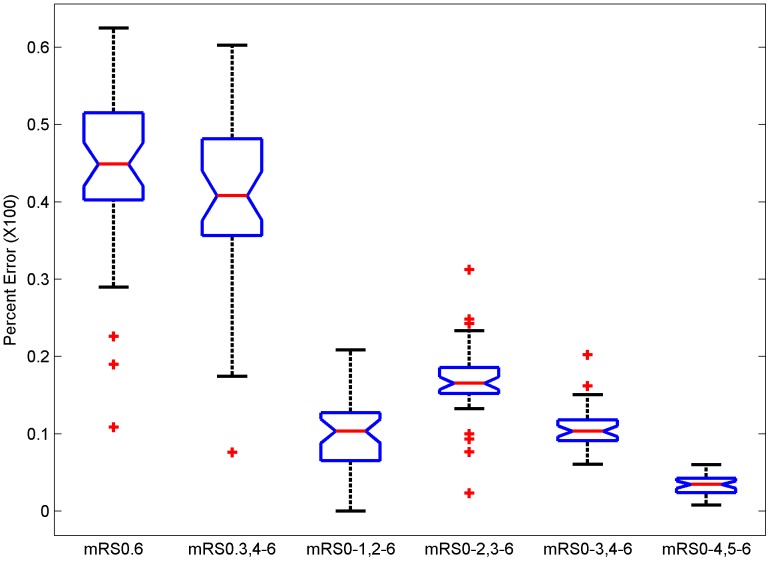
Box plots of error rates for the full ordinal scale of mRS (mRS 0.6), considering mRS 0 to 3 as individual grades and collapsing mRS grades 4 to 6 (mRS 0.3,4–6), dichotomizing at a cut-point of mRS 1 (mRS 0–1, 2–6), dichotomizing at a cut-point of mRS 2 (mRS 0–2, 3–6), mRS 3 (mRS 0–3, 4–6) and mRS 4 (mRS 0–4, 5–6). Post-hoc testing shows that each error rate with this matrix is higher than the corresponding error using van Swieten’s confusion matrix except the error rates for mRS 4.

