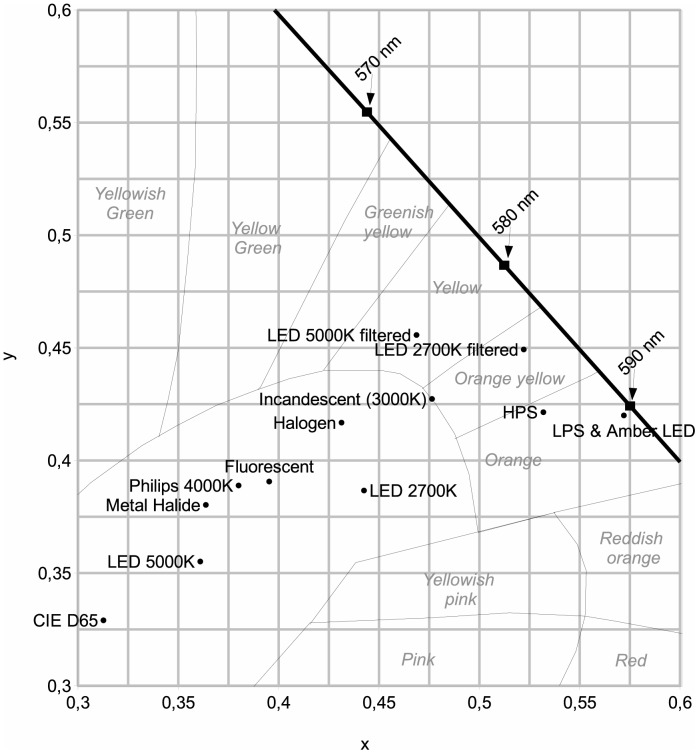
Figure 1. x and y chromaticity coordinates [52] for each lamp listed in Table 2.
On that figure, the spectral locus, which is the line for monochromatic light, is shown by the thick black line. Thin black lines indicate color zones. Black squares show monochromatic values, while small black circles are lamps.

