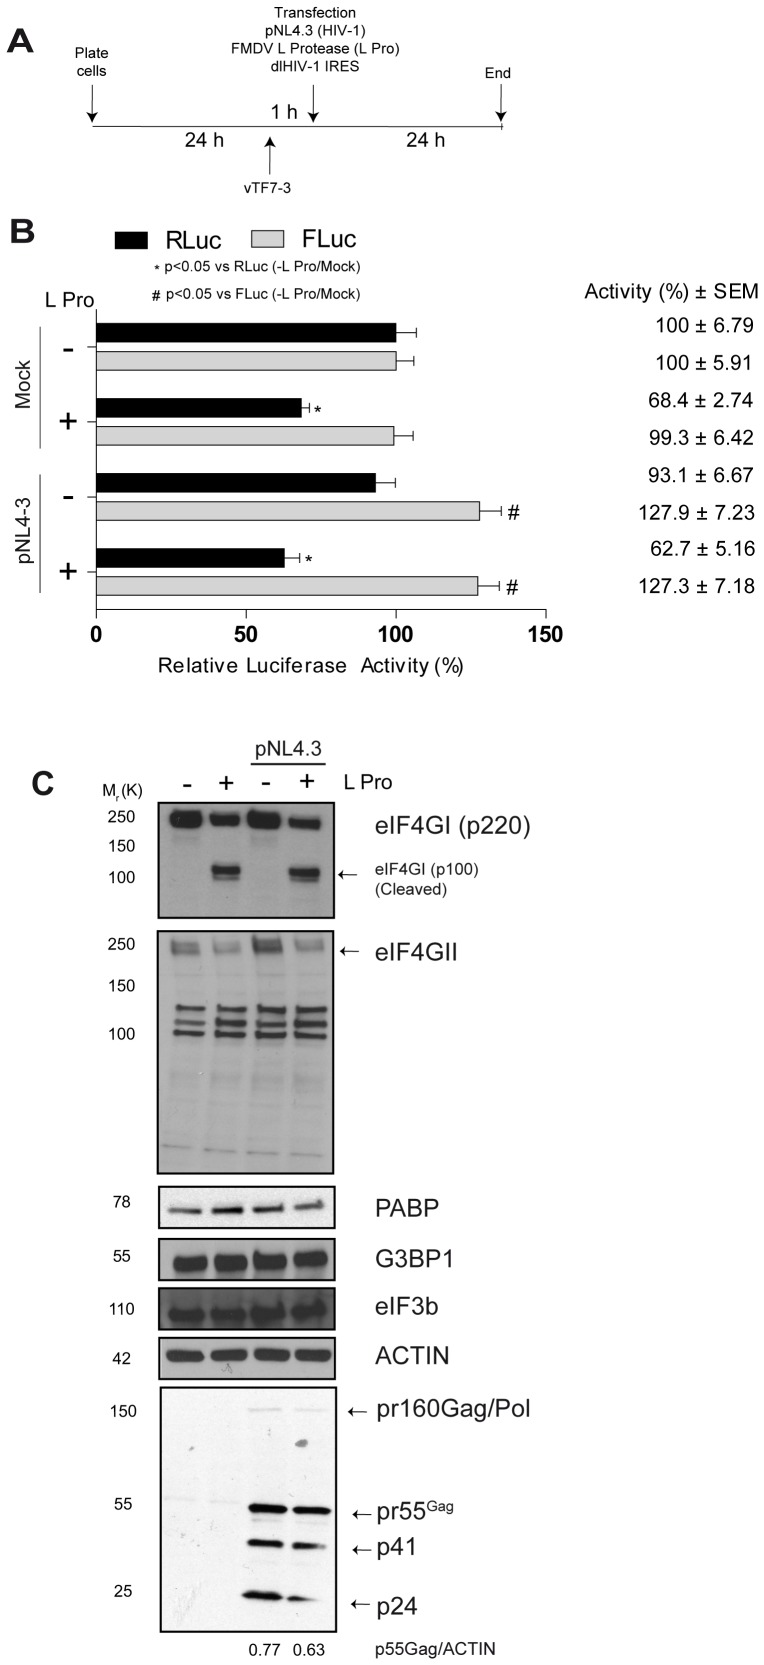
Figure 3. Examination of HIV-1 IRES expression and expression levels of viral proteins during the expression of FMDV L protease in cells.
(A) Schematic representation of the experimental protocol. (B). IRES activity levels were determined as described in Materials and Methods. RLuc and FLuc activities of the dl HIV-1 IRES in the uninfected “mock” cells in the absence of FMDV L protease were arbitrarily set to 100%. Statistical analysis was performed by the Student’s t-test (p<0.05) where (*) represents a significant difference v/s RLuc activity in uninfected “mock” cells in the absence of L Pro, while (#) represents a significant difference v/s FLuc activity in uninfected “mock” cells in the absence of L Pro (C). Whole cell lysates were analyzed for host eIF4GI, eIF4GII, PABP, G3BP1, eIF3b, Actin and pr55Gag by western blotting analyses.

