
Figure 1. SEM images of the titanium surface used in this study.
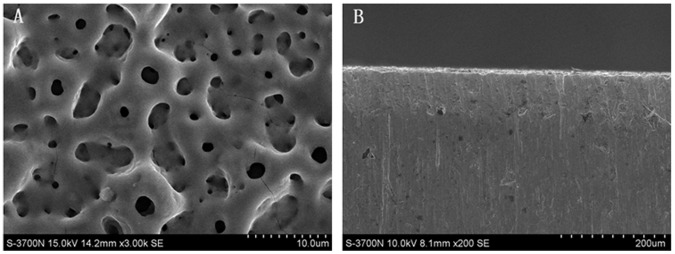
(A) MAO titanium surface (3000X) and (B) cross-sectional view (200X).
Official websites use .gov
A
.gov website belongs to an official
government organization in the United States.
Secure .gov websites use HTTPS
A lock (
) or https:// means you've safely
connected to the .gov website. Share sensitive
information only on official, secure websites.
(A) MAO titanium surface (3000X) and (B) cross-sectional view (200X).