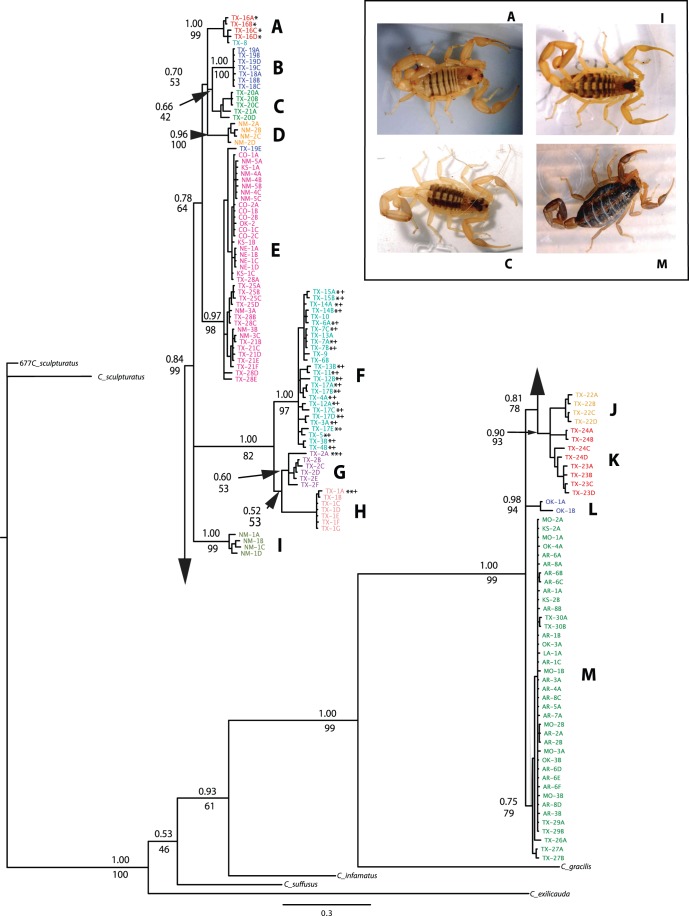
Figure 2. Bayesian Phylogenetic tree for C. vittatus populations and outgroups.
Numbers above nodes represent Bayesian posterior probabilities: bootstrap support values are shown below. Upper case letter designation of each clade represent networks produced in the TCS haplotype network analysis (see Fig. 4. and results for identification). Asterisked individuals (*) represent those identified as the C. pantheriensis variant with double asterisked clades (**) as those clades with all C. pantheriensis variants. Individuals or clades marked with a “+” symbol represent those specimens we identified as completely pale forms. Each color represents a general collection region: see results for further details. The inset box shows C. vittatus female morphologic diversity in four populations. The population designations are the same as in the Bayesian phylogenetic tree.

