
Figure 3. COI TCS networks for the three networks containing several population collection sites.
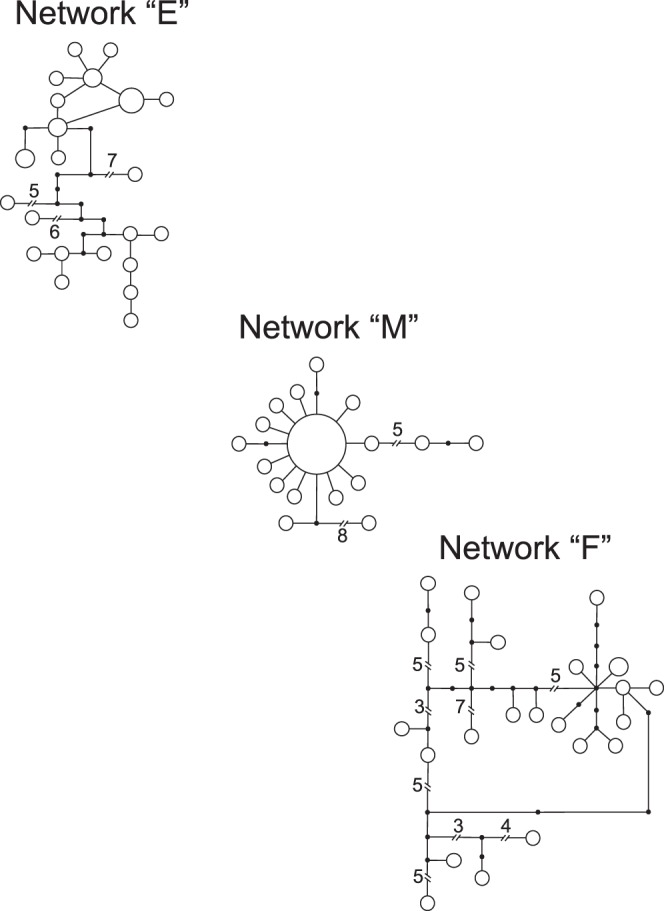
The networks shown here are “E” central Texas/eastern NM/CO/west KS/NE populations, “F” Big Bend, & “M” northeastern populations. The node size represents individual number for each haplotype from singletons (smallest) to six individuals (largest). The large node in network “M” represents 18 individuals. The numbers next to each line break represent mutational steps connecting nodes.