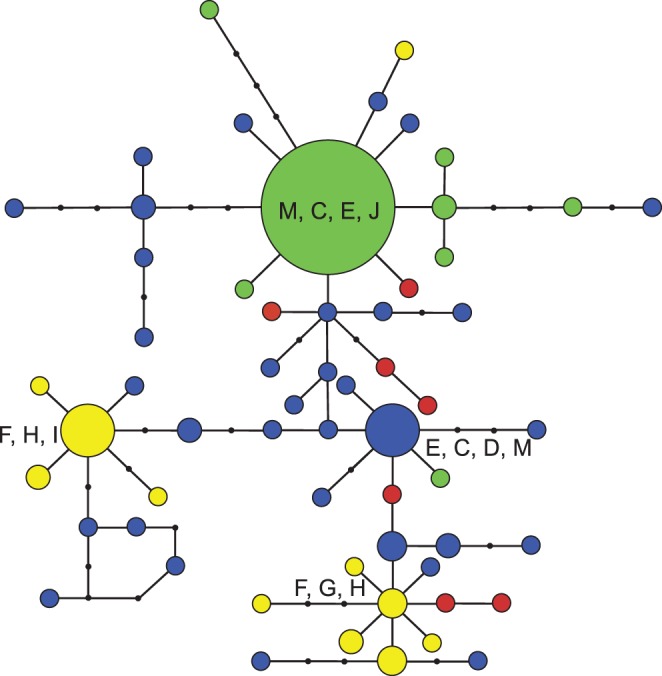
Figure 5. The haplotype network created from the nuclear 1075 locus.

Each haplotype node is color coded to the geographic clade with the most represented individuals in the node: Green: northeastern populations, Blue: central Texas/eastern NM/CO/west KS/NE populations, Yellow: Big Bend and Transpecos populations, & Red: Falcon, Seminole Canyon, and Laredo populations. The largest nodes are lettered with all represented COI geographic clades in each node with bold letters representing the most frequent geographic clade. The three largest nodes contained these numbers of individuals: Green: 39, Yellow: 20, & Blue: 15.
